

The 2018 AFDR is based on responses from 142 franchisors representing 85,734 units (74,000 franchised and 11,734 company-owned).
Participants of the survey consisted of franchisors that completed an online questionnaire. Responses were aggregated and analyzed to produce a detailed look into the recruitment and development practices, budgets, and strategies of a wide cross-section of franchisors. The data and accompanying commentary & analysis provide the basis of the 2018 AFDR.
Highlights based on the AFDR data were:
• Franchisors are expanding their methods of lead generation
• The two most important factors for development are franchisee validation and a strong sales process.
• Recruitment budgets were flat in 2017 vs. 2016.
• Half of ad spending for recruitment spending is for digital.
• Four in 10 brands still don’t track cost per lead or cost per sale.
• Franchisors exceeding goals have a higher cost per lead but lower cost per sale indicating that they are investing in finding the right candidate.
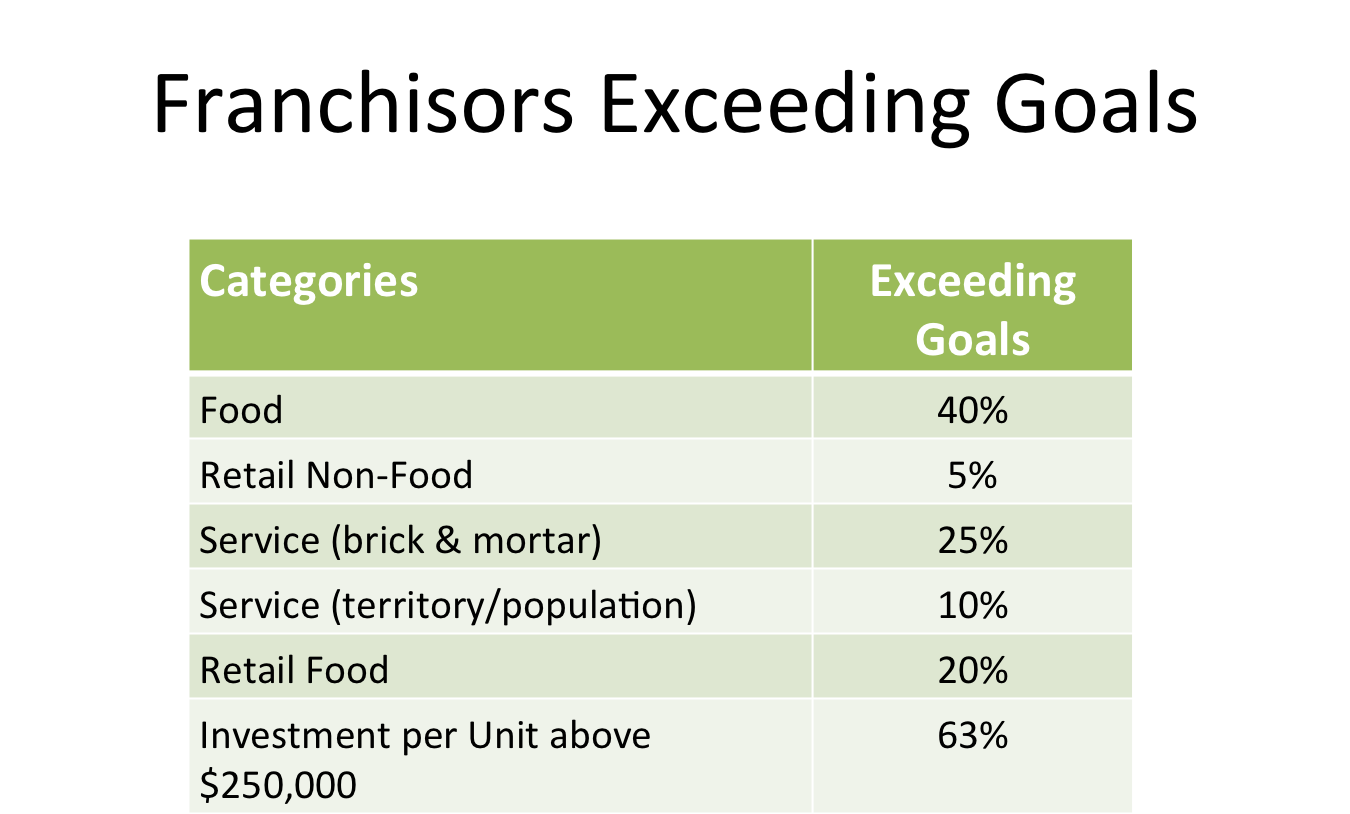
• 40 percent of food brands exceeded their goals in 2016.
Growth plans for 2018 from the 142 respondents target a total of 6,551 additional franchise units, 2,064 through existing franchisees and 3,926 from new franchisees. For comparison, last year’s growth plans from 167 brands targeted a total of 6,536 additional units; and for 2016 those numbers were 6,442 total new units from 134 brands.
Below are additional highlights from the 2018 AFDR.
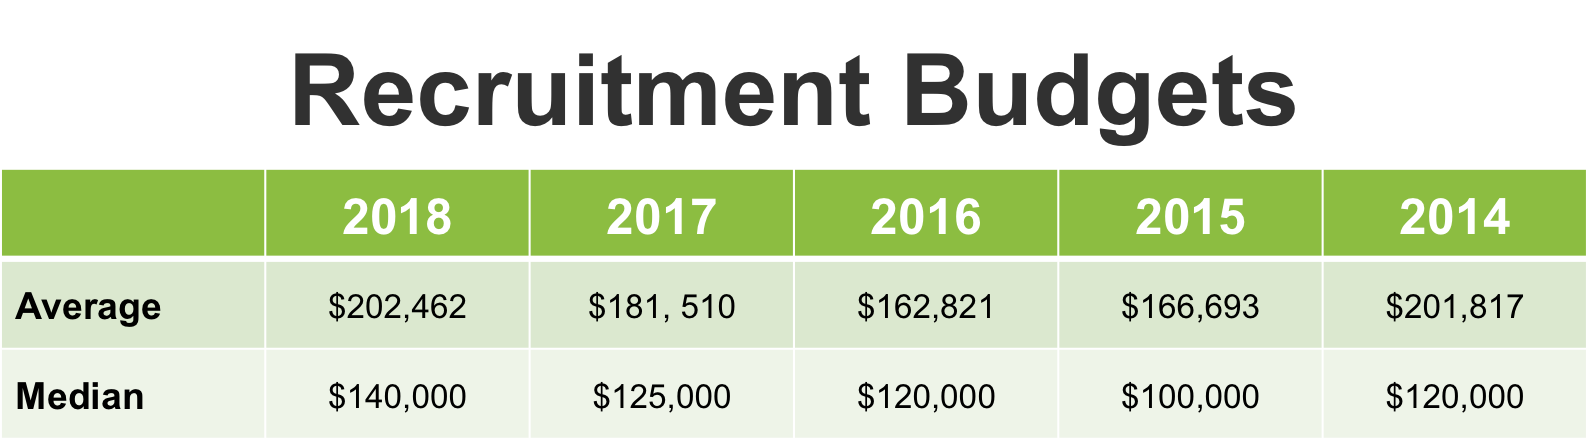
Average media budget plans for 2018 for franchise sales and recruitment (advertising and media expenses, not including brokers and employee compensation) among respondents was $202,462, with a median of $140,000. This is an increase from last year, where the corresponding numbers were $181,510 and $125,000. This could indicate more intense competition not only for quality candidates, but also higher internal costs stemming from salaries and commissions for the best sales people.
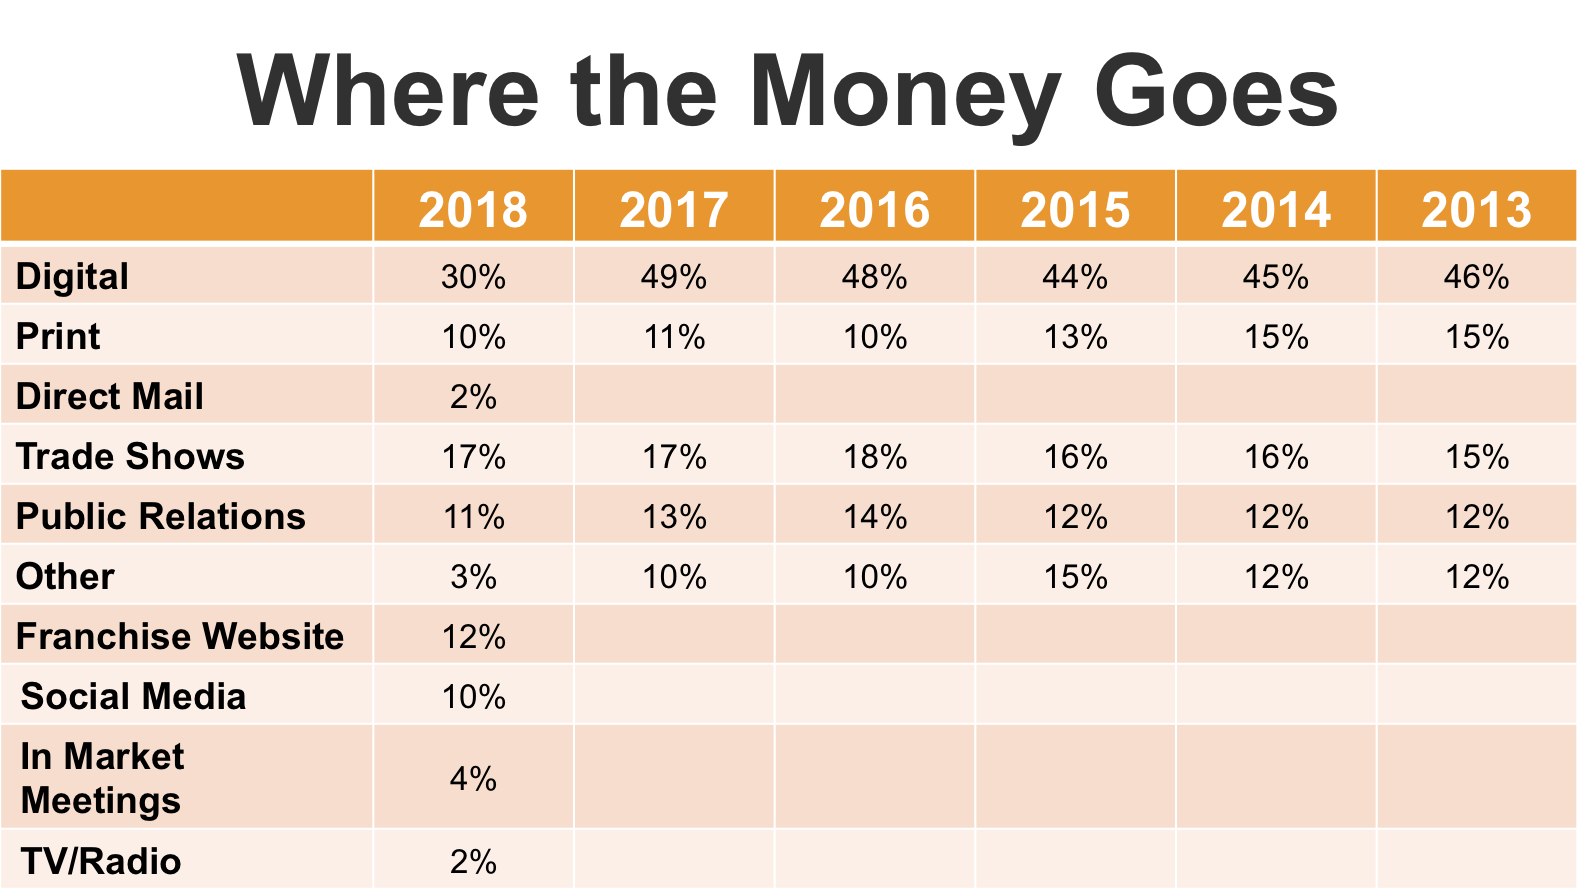
With the increased emphasis and steady shift to online recruitment methods, we did something new this year: we broke out spending on franchise websites and social media from the “digital” category. Adding back spending on franchise websites (12 percent) and social media (10 percent) shows a total of 52 percent on overall digital spend, up slightly from previous years. We also added three new categories this year to provide finer granularity—direct mail, in-market meetings, and TV/radio—which subsequently reduced the “other” category. Spending on print (10 percent), trade shows (17 percent), and public relations (11 percent) has remained essentially the same over the past 6 years, with print showing a gradual decline as digital takes a greater share.

Where the digital money goes. In recent years, as digital spending has accounted for an increasing percentage of recruitment budgets, we’ve asked franchisors to break out their digital spending by category. And this year, as we’ve done with overall spending, we’ve added new categories that used to be included in other numbers—franchise website (13 percent), social media advertising (12 percent), and digital asset creative (3 percent)—making direct comparisons with previous years more difficult, but also providing a deeper look into where development budgets are headed. This also reduced the “other” category. Next year’s AFDR will provide one-to-one comparisons year over year for these new categories.
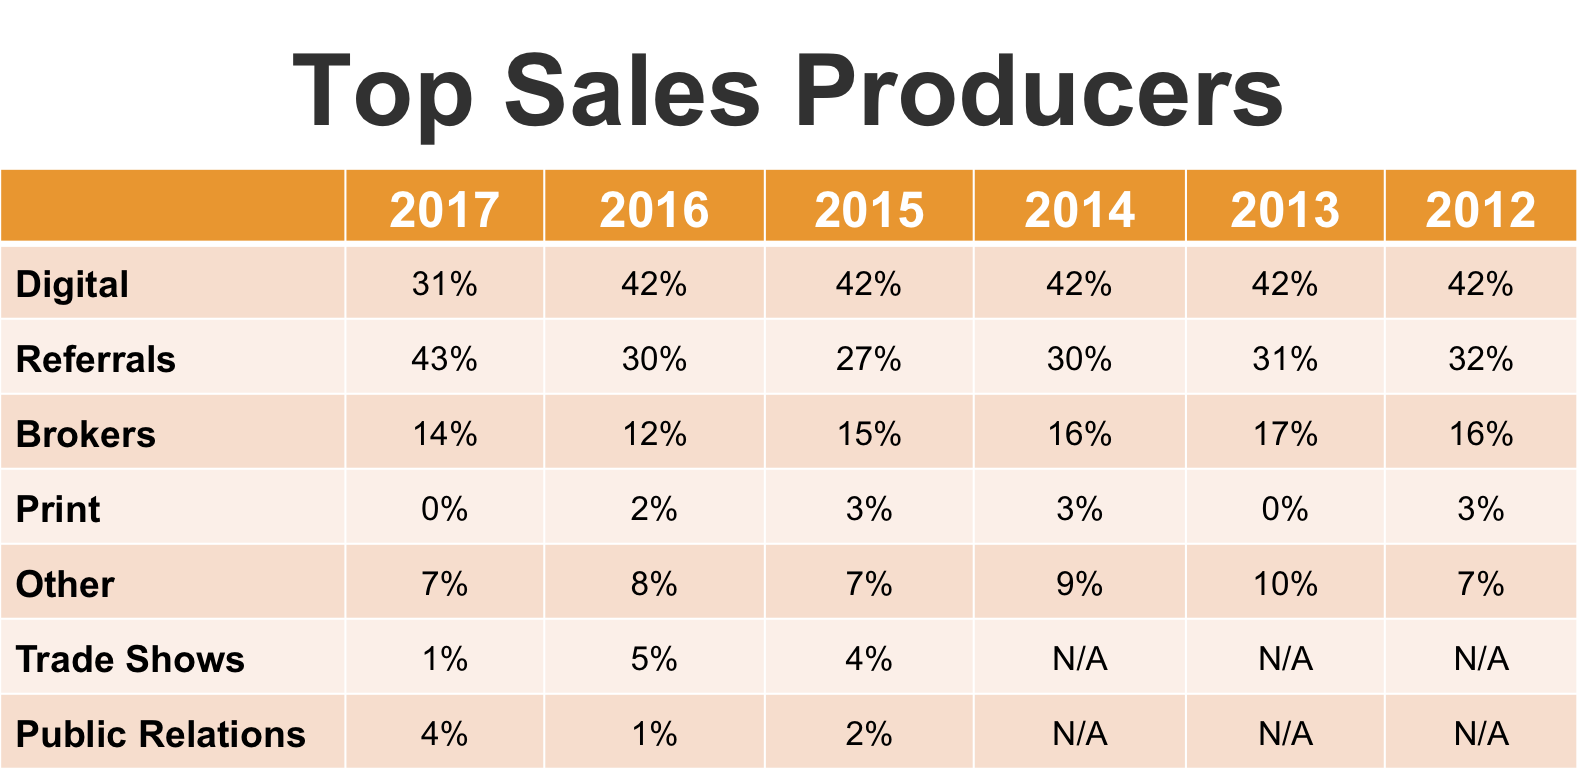
After taking the lead in 2012 as the top sales producer, digital took a hit in 2017, dropping from a remarkably steady 42 percent to just 31 percent this year. Yet, with the inexorable reliance on digital, this begs the question of attribution, said Diane Phibbs EVP & Chief Content Officer of Franchise Update Media. “Where do leads really come from?” she asked. “Where do they learn about the brand before they fill out the form on your website?” As Franchise Update Media Chair Gary Gardner pointed out 2 years ago, “The last click gets the credit.” He urged attendees to consider the extent to which their other efforts contribute to the more easily measured digital share of spending on sales. The other big difference from previous years is referrals—considered the strongest source of high-quality leads—which rose from about 30 percent in previous years to 43 percent this year.

We asked respondents to segment their digital spending as it relates to sales. Nothing startling here, but two trends to note over the past 5 years: 1) portals, after rising to account for about one in three sales in the past 3 years, fell to about one in four this year (26 percent); and 2) email marketing as a source of sales has risen steadily over the past 3 years, and at 10 percent has more than doubled from 2 years ago. Oddly, in this era of more data than we know what to do with, the “don’t know” category more than doubled from the past 2 years and is back to where it was in 2013. Again, it may be worth looking into attribution. If you don’t know where more than one in 10 of your sales is coming from, there’s room for improvement.

About six in 10 respondents (61 percent) said they track cost per lead (identical with last year), while 56 percent track cost per sale (57 percent last year). This means that four in 10 respondents still do not track their cost per lead, and slightly more don’t track cost per sale. With all due respect to franchise sales teams, are you kidding? To repeat our observations from last year, franchise recruitment experts continue to shake their heads and wonder how any professional sales team can set a budget, spend the money, and not measure the effectiveness of that effort. Why 100 percent of brands don’t track these critical metrics remains a mystery—and could be one reason that so many development departments continue to miss their annual sales goals. Among the six in 10 who do track these numbers, the average cost per lead reported in this year’s survey was $112, about the same as last year’s $109. However, the average cost per sale of $8,571 was up significantly from last year’s $7,558 (which was up from $6,300 the year before). So cost per lead remained about the same, but cost per sale continues to rise.

How about some good news? Applications-to-sales ratios and discovery days-to-sales ratios were both noticeably higher this year. The leads-to-sales ratio fell slightly though, for the second consecutive year. (Note: In 2014, our panel of experts categorized that year’s figures as unusually high, more of an aberration than a norm.) The biggest trend here is the steady increase in the applications-to-sales ratio, which rose to 26 percent from 20 percent last year, nearly matching even those 2014 numbers, and almost doubling from 2012. And while the ratio for discovery days to sales, at 72 percent, was up nearly 10 percent from last year’s 63 percent, it still fell short of the ratios reported in 2012 and 2013. Many factors contribute to closing ratios, so no hard conclusions to be drawn here. For perspective, two years ago we wondered if more unfit candidates were making it through to discovery days; if franchisors were becoming more selective in the final stage of the award process; or if the economy and financing issues were the reason for the declines. Last year asked if greater uncertainty during a sluggish economic recovery dampened the appetite for risk among candidates; if increased competition for prime real estate for the many brands with similar footprints was contributing to the decline; and if pre-qualifiers were making a difference where the ratios had improved. Whatever the reasons, the silver lining here is that almost three in four candidates making it through to discovery day are signing deals. Still, we must ask, with all the stages in the sales process, prospects coming in with more information than ever, and more and more technology being deployed at each stage, could—should?—these numbers be higher?
Unlike last year, where brands exceeding their sales goals spent much less on cost per lead than the average ($76.50 vs. $109), this year’s “exceeders” spent more ($128 vs. $112). When it came to cost per sale, however, brands that exceeded their goals spent much less than the average when compared with the year before—$6,398 vs. an average $8,571 this year, compared with $6,266 vs. an average of $7,558 last year—so even though they spent slightly more than last year to close a deal, when measured against the average cost per sale, they performed relatively better in 2017. They also exceeded the average ratios for applications to sales (31 percent vs. 26 percent) and discovery days to sales (79 percent vs. 72 percent). Among other things, these numbers indicate that franchisors exceeding their goals are much more efficient in their recruitment spending than the average.
10 Differentiators
The following are nine of the most important things more successful brands have seen or done in their franchise recruitment and development efforts that helped them to rise above the competition:
• Higher cost per lead, lower cost per sale
• Higher conversion rate of leads, applications, and discovery days
• 80 percent reported the quality of leads is up
• 95 percent described unit-level business conditions as good (68 percent of franchisors below goals described business conditions as good)
• Focused, strategic growth
• Use multiple marketing vehicles
• Use local marketing strategies
• Allocate dollars specifically to their franchise opportunity website
• Shop their competition